3. Simple method for predicting earthquake damage
- A Precise and simple method was developed for carrying out seismic hazard analysis.
- This method allows simple calculation of probability of structural damage and areas
Decisions where to apply seismic retrofit to railway lines, in which order of priority and choosing the necessary level of reinforcement, require a seismic hazard evaluation method focused on structural damage and operational safety.
The present research aims to yield an improved and more easily applicable method for evaluating the probability of seismic damage to railway lines. The method begins with the evaluation of seismic intensities (maximum ground acceleration or PGA, and maximum ground velocity or PGV) and corresponding occurrence probabilities at each location alongside the target line, taking into account fault properties and amplification characteristics of surface ground. A fragility curve combining the structural properties (natural period T, yield seismic coefficient Khy), seismic intensity and damage (Fig 1)) is then proposed, based on non-linear dynamic analysis. A fragility curve evaluating the seismic intensity and train running safety is also proposed.
By incorporating the strength and occurrence probability of an expected earthquake into these fragility curves, it is possible using only four parameters (PGA, PGV, T, Khy) to distinguish structures with high probability of suffering earthquake damage as well as the area where operational safety will be badly affected, without complicated earthquake response analyses. Furthermore, a simple regression expression estimating the structural properties (T and Khy) only from the height of structure is proposed. This method is an economical solution for characterizing large numbers of structures, even if they have not been examined in detail.
The above method was applied to hypothetical Japanese high speed lines. Results gave confirmation of locations subject to significant seismic motion (Fig 2 0-10 km radius zone) and vulnerable spots which did not suffer major seismic motion but had structures with weaker resistance (Fig 2, within a radius of 15, 26, 45, 55 km) and where there was a subsequent high risk of earthquake damage.
 Fig. 1 Example of a structure’s earthquake damage ratio curve
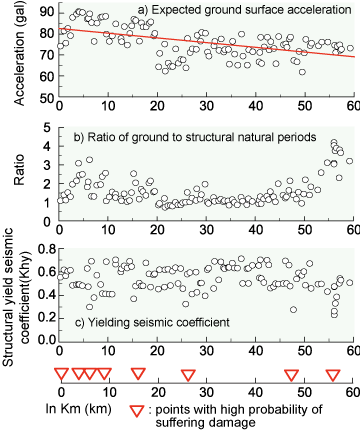 Fig. 2 Sample of relatively vulnerable spots based on the calculated damage probabilities
- HOME > Major Results of Research and Development in Fiscal 2010 > I Safety/Reliability
-

RTRI HOME - Copyright(c) 2012 Railway Technical Research Institute