2. Equivalent sensitivity curve reflecting subjective response to high frequency vibration
- In order to evaluate the ride comfort on board high speed trains, the level of sensitivity to high frequency vibrations was raised and an equivalent sensitivity curve which reflected passenger subjective response to a higher degree, was proposed.
- Vibration assessments made during train operation revealed that the influence of low frequency noise was negligible.
As the speed of Shinkansen trains increases, it has become clear that high frequency vibration in the region of 30 Hz influences ride comfort. However, in the equivalent sensitivity curve used to calculate current ride comfort level, sensitivity to high frequency is low, which means that it has a weak loading factor. The problem therefore, is that present calculations including this type of high frequency will produce a result which does not represent the perceived ride comfort.
Therefore, a survey was carried out to modify the sensitivity associated with the vibration range between 1-50Hz deemed responsible for low-ratings of ride comfort. Following this, a new equivalent sensitivity curve, was devised and produced by adjusting the high frequency range attached to the existing equivalent sensitivity curve (vertical and lateral vibration) which reflected passenger subjective response more closely and was without seat-type distinction (Fig 1). The effectiveness of the new proposal was examined with test subjects on board commercial Shinkansen rolling stock and a vibrating test bench (Fig 2). This confirmed that the modified ride comfort level was a closer reflection of the perceived ride comfort.
Next, a survey was performed to determine the influence of high frequency vibration and acoustic noise in the same bandwidth (low frequency noise). The outcome revealed that although single waveform noise similar to since waves affected assessment, the effect of wide bandwidth rolling noise was negligible.
Furthermore it was determined that the ride quality value obtained with the modified method in the case of conventional lines was almost the same as that obtained with the former system. Consequently, even after replacing the former method, the modified approach could be applied in the same way and could be employed in conjunction with previously collected measurements.
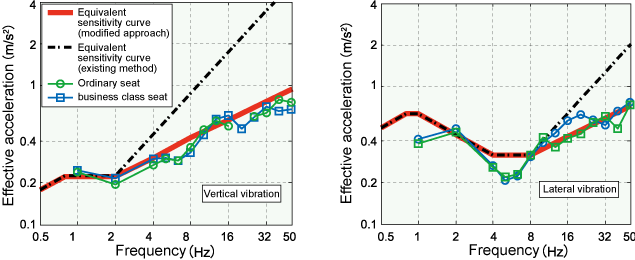 Fig. 1 Equivalent sensitivity curve (modified and present methods) and test results
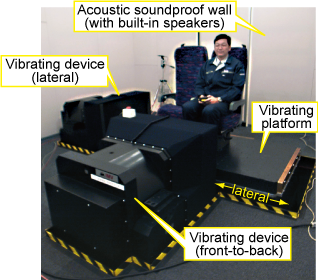 Fig. 2 Simulator for assessment of vibration and acoustic noise of trains
- HOME > Major Results of Research and Development in Fiscal 2010 > IV Comfort/Convenience
-

RTRI HOME - Copyright(c) 2012 Railway Technical Research Institute