
12. Damage Estimation and Visualization Tool for Signaling Facilities Affected by Snow Dropping from High-Speed Vehicles
In snowy regions, snow accretion on vehicles can drop down during high-speed operation in warm section (i.e. long tunnels), and damage signaling facilities. When significant snow accretion is expected, signaling facilities are visually inspected during nighttime inspections. However, these inspections are time-consuming.
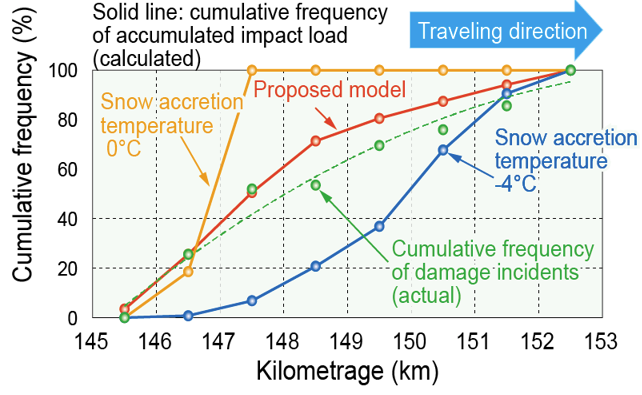
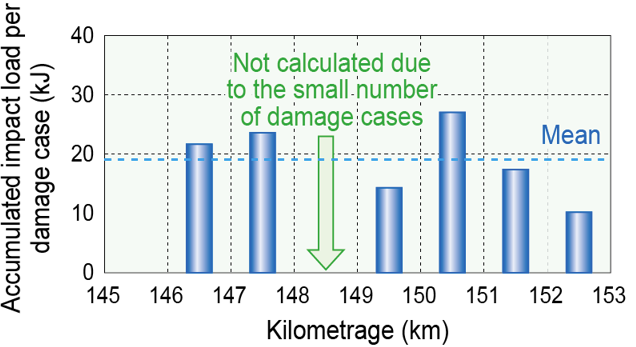
To realize efficient inspections, we first developed a method for estimating damage to signaling facilities caused by snow dropping. Because snow dropping occurs when the portion of the accreted snow in contact with the vehicle melts, the temperature that causes snow accretion is a key factor. In this study, we developed a snow-dropping model that uses the ambient air temperature as the temperature of snow accretion when a train enters a tunnel, and validated the model using a tunnel approximately 7 km long where snow-dropping damage to signaling facilities is particularly significant. A comparison between the cumulative frequency of damage incidents recorded over seven years and the calculated cumulative frequency of impact loads caused by snow dropping showed that the proposed snow-dropping model can reproduce the frequency distribution of snow dropping from the tunnel entrance more accurately than models assuming a constant temperature (−4°C or 0°C) that causes snow accretion (Fig. 1). Furthermore, based on the average cumulative impact load of 20 kJ per damage incident calculated by this model (Fig. 2), we developed a method for estimating the damage probability level of signaling facilities.
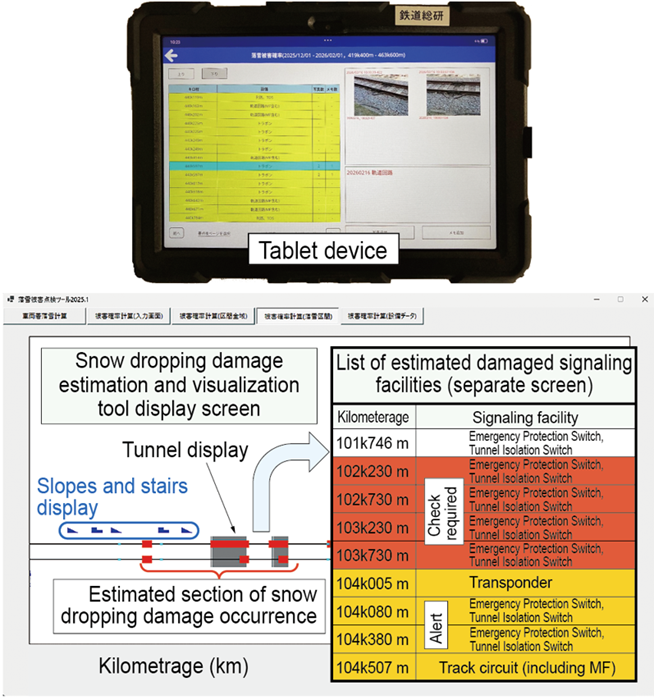
Next, based on the proposed method, we developed a tool that uses weather data along the railway line, infrastructure information such as tunnels and open sections, and train operating conditions to calculate snow accretion growth, snow dropping locations, and the need for signaling facility inspections, and implemented the tool on a tablet device. After approximately 10 minutes of calculation, the tool displays sections where damage is predicted and lists the signaling facilities located within those sections (Fig. 3).
By using this tool, sections requiring priority inspection and the signaling facilities within those sections can be identified in advance, improving on the efficiency of the inspections.
Other Contents
- 7. Fretting Wear Mitigation Method for Axle Journal Bearings
- 8. Construction, Inspection, and Reinforcement Methods for Preventing Fracture of Aluminothermic Weldings
- 9. Rail Head Transverse Crack Detection using Guide Waves
- 10. Automation of Spalling Condition Assessment Using Hammering Sound Judgment AI and Hammer Auto-tracking
- 11. Embankment Quality Control Methods Using Construction Phase Settlement Data
- 12. Damage Estimation and Visualization Tool for Signaling Facilities Affected by Snow Dropping from High-Speed Vehicles
- 13. Marker-Assisted Platform Position Measurement Using Forward-View Train Images
- 14. Anomaly Screening Method for Overhead Contact Line Equipment Requiring High-Frequency Inspection
- 15. Method for Identifying Causes of Failures in Electric Point Machines
- 16. Performance Evaluation Method for Inspection Systems Using Cameras and Sensors Based on CG Simulation
- 17. Method for Constructing 3D Railway Track Spatial Data Using In-service Trains
- 18. Safety Confirmation-Based Train Control System
- 19. Comprehension Visualization System for Trainees in Remote Lectures for Driver Training
- 7. Fretting Wear Mitigation Method for Axle Journal Bearings
- 8. Construction, Inspection, and Reinforcement Methods for Preventing Fracture of Aluminothermic Weldings
- 9. Rail Head Transverse Crack Detection using Guide Waves
- 10. Automation of Spalling Condition Assessment Using Hammering Sound Judgment AI and Hammer Auto-tracking
- 11. Embankment Quality Control Methods Using Construction Phase Settlement Data
- 12. Damage Estimation and Visualization Tool for Signaling Facilities Affected by Snow Dropping from High-Speed Vehicles
- 13. Marker-Assisted Platform Position Measurement Using Forward-View Train Images
- 14. Anomaly Screening Method for Overhead Contact Line Equipment Requiring High-Frequency Inspection
- 15. Method for Identifying Causes of Failures in Electric Point Machines
- 16. Performance Evaluation Method for Inspection Systems Using Cameras and Sensors Based on CG Simulation
- 17. Method for Constructing 3D Railway Track Spatial Data Using In-service Trains
- 18. Safety Confirmation-Based Train Control System
- 19. Comprehension Visualization System for Trainees in Remote Lectures for Driver Training